waiting-queues
Waiting queues
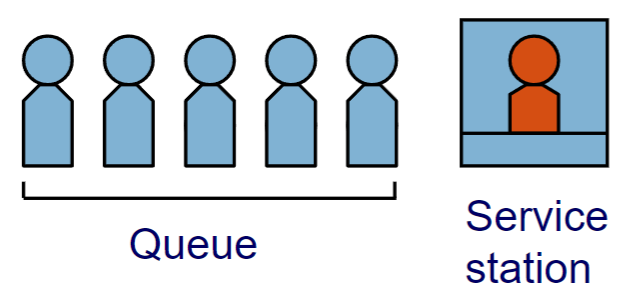
Parameters and characteristics
Waiting queues are described using a special notation: a/b/c
a: Probability distribution of arrival rate
- D: Deterministic
- M: Poisson
- G: General
b: Probability distribution of service time
- D: Deterministic
- M: Exponential
- G: General
c: Number of servers
All waiting queues run under these assumptions:
- No restriction of the waiting room
- Prioritization of customers is FCFS (first-come-first-serve)
| Queue | Characteristics |
|---|---|
M/M/1 |
Poisson-distributed arrivals often realistic |
| Exponentially distributed handling times often out of touch with reality | |
| Very nice analytical properties: E.g. distribution of output is Poisson | |
| Very simple formulas for key performance indicators | |
M/M/c |
Like M/M/1 with more than one server |
| Formulas for key performance indicators more complex than for M/M/1 | |
M/G/1 |
Often more realistic than M/M/1, since distribution of handling times arbitrarily |
| Distribution of output not Poisson | |
| Simple formulas available for some KPIs | |
G/G/c |
Very realistic modeling possible |
| Calculation of performance, if possible, very complex |
Modeling M/M/1 queues
For M/M/1 queues there are analytical properties available. These can be modeled via a probability model.
: Average interarrival time ( ) : Arrival rate ( )
: Average service time ( ) : Service rate ( )
: Utilization factor ( ), expected number of customers
: Number of customers in the system (queue + service) : Probability that there are customers in the system at any given time
: length system, expected number of customers in the system : Length queue, expected number of customers in the queue
: expected time of a customer in the system : Waiting time queue, expected time of a customer in the queue
Modelling M/M/1 networks
A waiting queue network combines multiple waiting queues together.
, : Are in all cases trivial the sum of the queues
, : Need to take into account the relative probability if any.
Sequential
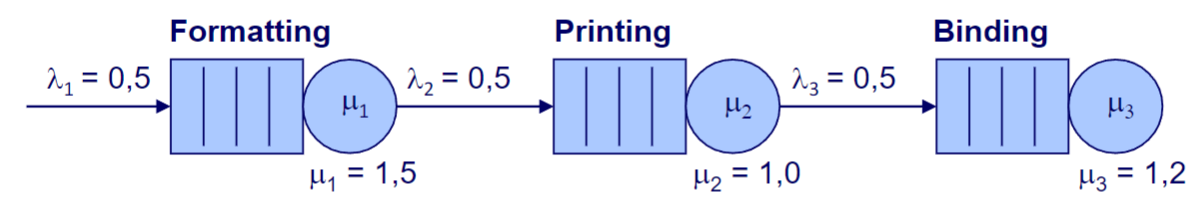
Due to the poisson distribution (
, : Is equal to the sum of all and respecivley.
Separation
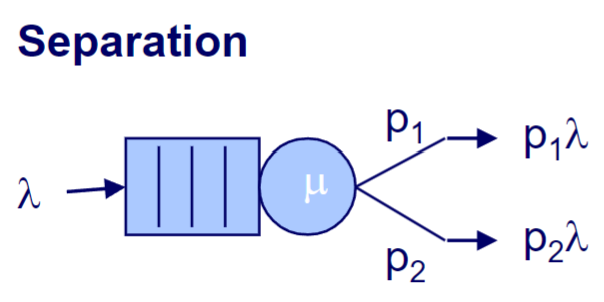
, : The probabilities going into one of the branches , : The arrival rate for the different branches
Integration
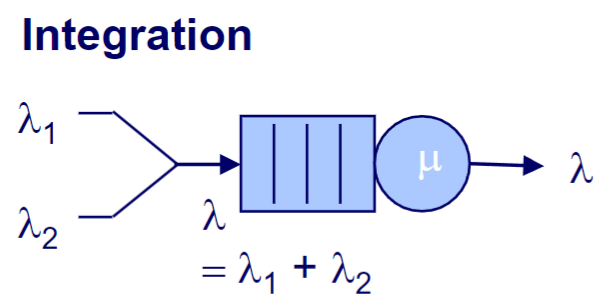
, : The arrival rate from the different branches : Is defined by the combined arrival rate
Recursion
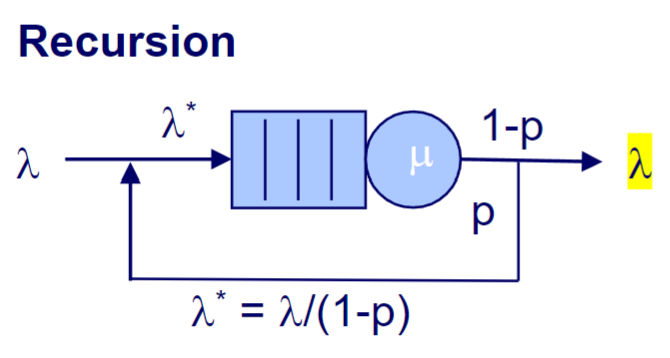
, : The probability of doing a recursion : The arrival rate with the recursion taken into account